-
Bug
-
Resolution: Done
-
Major
-
OSSM 2.5.1
-
False
-
None
-
False
-
Release Notes
-
Release Notes
-
-
Bug Fix
-
-
When you open Istio Service or Istio Workload dashboards in Grafana, they are not loaded correctly and this error shows up:

The browser console contains the following error
runRequest.catchError {"message":"\"Forbidden\"","status":403,"statusText":"Forbidden"}
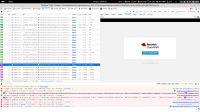
and a request (in browser network monitor) on grafana api /api/datasources/1/resources/api/v1/query shows OCP login page as a response ( see image )

Prometheus pod contains the following error: ( mkralik is a user in htpasswd idp )
2024/04/08 13:28:38 oauthproxy.go:790: basicauth: 10.131.0.112:48962 mkralik not in HtpasswdFile
I have also tried with Kubeadmin, the same error:
2024/04/08 13:31:16 oauthproxy.go:790: basicauth: 10.131.0.112:56654 kube not in HtpasswdFile
- is related to
-
OSSM-6163 OSSM 2.5.0 Fix Prometheus and Grafana dashboard errors
-
- Closed
-
- links to
- mentioned on

